

How to Improve IB Physics Practical Work, Uncertainty Calculations, and Lab Reports
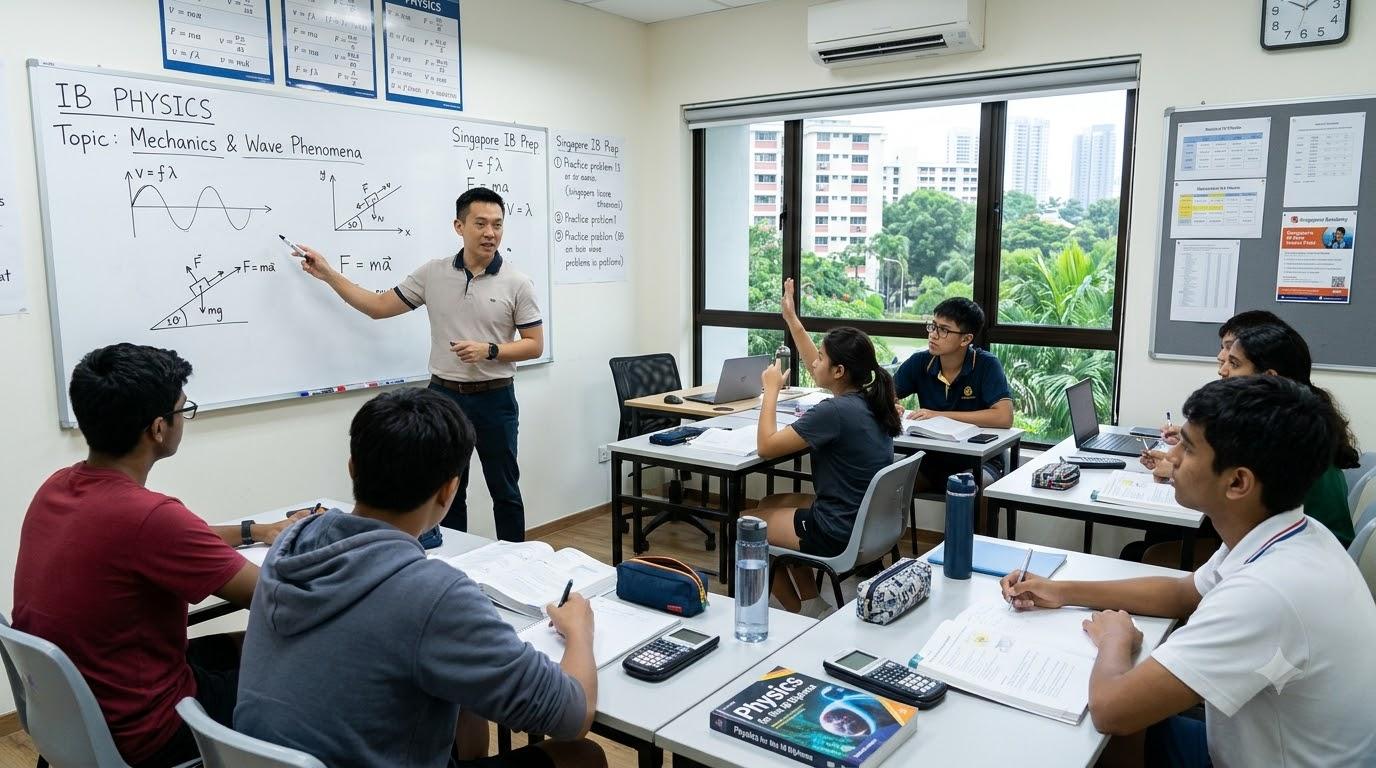
A student can understand the physics behind an experiment and still lose marks in practical work. The problem may be an unclear method, too few measurements, inconsistent units, poor graph presentation, or a conclusion that claims more than the data supports.
Practical investigations require a different set of skills from solving a textbook problem. You must collect reliable measurements, recognise limitations, process data correctly, and explain how the evidence supports your conclusion.
Students who want to strengthen their practical performance can benefit from ib physics tuition focused on experimental skills and scientific reasoning. The key is to treat practical work as a chain of decisions: each measurement and calculation should help answer a clearly defined research question.
1. Begin with a Testable Research Question
A weak research question may be too broad to guide an experiment. For example, “What affects the motion of a trolley?” does not specify the independent variable, the dependent variable, or how the motion will be measured.
A more useful question would investigate how changing the angle of an inclined plane affects the acceleration of a trolley, while keeping relevant conditions consistent.
A strong research question should identify:
-
The independent variable you deliberately change.
-
The dependent variable you measure or calculate.
-
Important variables you intend to control.
-
The physical relationship you are investigating.
This structure helps you select suitable equipment and decide which data to record. It also makes the final conclusion easier to write because the conclusion can directly answer the original question.
Before collecting data, ask whether the measurement method can detect the expected change. If the predicted effect is smaller than the instrument's resolution or is overwhelmed by random variation, you may need a different method.
2. Design a Method That Produces Useful Evidence
A method should be detailed enough for another student to repeat. It should not simply list equipment or describe the experiment in general terms.
For each step, consider why it is necessary. If you measure a distance, explain which points define that distance. If you use a timer, decide how you will reduce reaction-time effects. If you change a variable, state how you will keep other important factors consistent.
Use a planning table
|
Planning question |
What to decide |
Why it matters |
|
What will I change? |
Independent variable and range |
Defines the investigation |
|
What will I measure? |
Dependent variable and instrument |
Determines the data collected |
|
What must remain consistent? |
Relevant control variables |
Improves fairness |
|
How many readings are needed? |
Repeats and measurement points |
Helps assess variation |
|
What could distort the results? |
Likely sources of error |
Guides improvements |
Do not add control variables simply to make the method look sophisticated. Choose variables that could plausibly affect the measured outcome.
For example, when investigating the relationship between force and acceleration, the total moving mass and the method of measuring acceleration may matter. In a cooling investigation, the container, starting temperature, surroundings, and temperature-measurement procedure may influence the results.
3. Understand Resolution, Uncertainty, and Precision
These terms are related but not interchangeable.
Resolution describes the smallest change an instrument can display or distinguish. A digital balance that displays mass to the nearest 0.01 g has a different resolution from one that displays to the nearest 1 g.
Uncertainty expresses the range of doubt associated with a measurement or calculated result. Its treatment depends on the instrument, measurement method, and instructions given for the investigation.
Precision concerns how closely repeated measurements agree with one another. Repeated measurements can be precise but still inaccurate if a systematic error affects every reading.
Suppose a student measures the same length several times and obtains similar results. That consistency is useful, but it does not prove the measured length is correct. The ruler might have a damaged zero point or be aligned incorrectly.
When working through ib physics tuition in Singapore exercises, students should practise identifying which quantity is being discussed before selecting a formula or describing the quality of measurements.
Absolute and percentage uncertainty
Absolute uncertainty is expressed in the same units as the measured quantity. Percentage uncertainty compares the uncertainty with the size of the measurement:
[
\text{Percentage uncertainty} =
\frac{\text{absolute uncertainty}}{\text{measured value}}\times100%
]
For example, if a length is recorded as 20.0 cm with an illustrative absolute uncertainty of 0.2 cm, the percentage uncertainty is 1%.
This calculation is only meaningful when the stated uncertainty is justified by the instrument and measurement procedure. Do not assign a value automatically without considering the actual experiment and the conventions required by your course.
4. Use Repeated Measurements Intelligently
Repeating measurements can help reveal random variation, but repetition should be planned rather than added without purpose.
If readings differ slightly, calculate an appropriate average when the data and method justify doing so. Record the original measurements as well as the processed value. Keeping raw data allows you to identify unusual readings and check calculations later.
Do not remove an inconvenient result merely because it does not match the expected pattern. First investigate whether there is a documented reason to treat it as an anomaly. A reading should not be excluded solely because it weakens your hypothesis.
When time is limited, choose a sensible range of independent-variable values and enough repeats to assess consistency. A large number of nearly identical readings may provide less insight than measurements spread across a useful range.
5. Make Graphs Tell the Physics Story
A graph should help reveal a relationship, not just display points.
Start by deciding which variable belongs on each axis. In many investigations, the independent variable is placed on the horizontal axis and the dependent variable on the vertical axis. Label both axes with the quantity and unit.
Use a scale that makes good use of the available graph area. Plot the data carefully, then decide whether a straight line, curve, or other representation is appropriate to the model being investigated.
Do not connect every point automatically. A line of best fit is usually intended to represent the overall trend, not to pass through every measurement. The correct approach depends on the expected relationship and the instructions for the task.
If a graph is linear, its gradient may represent a meaningful physical quantity. Before calculating it, identify what the gradient means from the equation being tested. Choose two points well separated along the fitted line, show the calculation, and include the correct units.
A graph can also reveal limitations. A point far from the trend may indicate random variation, an experimental problem, or a limitation in the assumed model. Investigate the reason rather than simply hiding the point.
6. Example One: Investigating the Period of a Pendulum
Suppose a student investigates how the length of a pendulum affects its period.
A common weakness is timing one oscillation by hand. The measured time may be strongly affected by reaction time, especially when the period is short.
A more reliable method is to time several complete oscillations, divide the total time by the number of oscillations, and repeat the measurement. The student should use a consistent definition of one oscillation and release the bob without deliberately pushing it.
A suitable data table should include the pendulum length, the number of oscillations timed, total time, calculated period, and relevant uncertainty information. The precise processing method depends on the research question.
If the investigation tests the standard pendulum model, a graph of period squared against length may be useful because the theoretical relationship can be expressed in a linear form under suitable assumptions. The student must still explain why that graph is appropriate and what its gradient represents.
Evaluation might address reaction time, the measurement of length from the pivot to the centre of the bob, air resistance, and whether the initial angle was kept sufficiently small for the model used.
7. Example Two: Investigating Resistance and Temperature
Imagine a student measures the resistance of a conductor as its temperature changes.
The method must explain how temperature is changed and measured, how resistance is obtained, and how the student avoids recording a temperature that does not represent the conductor's actual condition.
Possible problems include poor thermal contact, uneven heating, changes in the surrounding environment, and taking readings before the system stabilises.
A useful investigation would record temperature and resistance systematically, repeat measurements where appropriate, and plot the relationship in a form that addresses the research question.
The student should not claim that the data proves a universal law from a narrow range of measurements. The conclusion should describe the trend observed, compare it with the expected relationship, and acknowledge limitations.
8. Write an Evaluation That Leads to Specific Improvements
“Human error occurred” is rarely a useful evaluation by itself. It does not identify what went wrong or explain how to improve the method.
A stronger evaluation links a limitation to its effect on the data and proposes a realistic improvement.
|
Limitation |
Possible effect |
Specific improvement |
|
Manual timing |
Reaction-time variation |
Time multiple cycles or use suitable electronic timing |
|
Poor instrument alignment |
Systematic measurement offset |
Check alignment and zero before recording |
|
Too narrow a variable range |
Weak evidence of the relationship |
Extend the range where safe and appropriate |
|
Too few repeats |
Uncertainty is harder to assess |
Repeat key measurements |
|
Temperature not stabilised |
Readings may not represent equilibrium |
Allow the system to stabilise before recording |
Not every improvement is practical. A good report acknowledges limitations honestly and proposes changes that directly address them.
Students using ib physics tuition for practical preparation should practise explaining why an improvement would help. “Use better equipment” is vague; “use a light gate to reduce uncertainty from manual timing” is much more specific when that equipment is suitable and available.
9. Illustrative Case Study: Making a Report More Defensible
This is a hypothetical learning example, not a report of an actual student.
A student investigates how the mass attached to a spring affects its oscillation period. The first draft contains a graph and a short conclusion, but it does not explain how the timing was performed. Only one reading was recorded for each mass, and the evaluation says simply that “measurements were not accurate.”
The student revises the method by timing multiple oscillations, repeating measurements, recording raw values, and explaining how the period is calculated. The graph is labelled with quantities and units, and the fitted trend is compared with the expected model.
The evaluation now identifies specific limitations, explains their likely influence, and proposes realistic improvements. The conclusion also avoids claiming more than the measured range supports.
The report becomes stronger because the evidence and reasoning are traceable. The student has not eliminated all uncertainty; they have explained it more carefully.
10. A Practical Revision Plan
Use a weekly rotation to practise different practical skills instead of repeatedly revising only equations.
-
Week 1: Instrument resolution, absolute uncertainty, and percentage uncertainty.
-
Week 2: Raw-data tables, averages, and appropriate significant figures.
-
Week 3: Graph selection, gradients, units, and interpretation.
-
Week 4: Research questions, control variables, limitations, and improvements.
After each exercise, mark the work against your teacher's instructions and the relevant assessment criteria. Keep a list of recurring errors, such as missing units, unsupported conclusions, or unclear methods.
The purpose of ib physics tuition is not to memorise generic laboratory paragraphs. It is to develop the ability to select suitable methods, process evidence, and explain the limitations of a specific investigation.
Conclusion
Strong practical work combines a clear research question, a repeatable method, appropriate measurements, careful data processing, and a conclusion that matches the evidence. Uncertainty is not something to hide; it is part of scientific reasoning.
Students improve when they learn to connect each limitation to its likely effect and propose a realistic improvement. Practise with different experimental contexts, review the reasoning behind each calculation, and use feedback to address recurring weaknesses.
Frequently Asked Questions
1. Should I repeat every measurement in an IB Physics investigation?
Repeats are useful when they help assess variation or improve the reliability of a result. The number of repeats should suit the investigation, available time, and instructions.
2. Is percentage uncertainty always calculated the same way?
The basic relationship compares absolute uncertainty with the measured value. However, how uncertainty is assigned and propagated depends on the quantity, instruments, method, and applicable course guidance.
3. What makes a physics evaluation strong?
A strong evaluation identifies a specific limitation, explains how it could affect the results, and proposes a practical improvement that addresses the limitation.
4. Should every graph have a straight line of best fit?
No. The graph and fitted relationship should match the model being tested and the observed data. Some investigations require a curve or a transformed set of variables.
5. How can I avoid losing marks for units and significant figures?
Record units in table headings, carry units through calculations, and use a consistent level of precision that is justified by the measurements and task instructions.
6. What should I do if my experimental results do not match the theory?
Check calculations, measurement procedures, assumptions, and possible sources of uncertainty. Report the observed pattern honestly and discuss plausible explanations without inventing a cause that the data cannot support.

 Arabic
 French
 Spanish
 Portuguese
 Deutsch
 Turkish
 Dutch
 Italiano
 Russian
 Romaian
 Portuguese (Brazil)
 Greek